How the UK Generated Its Electricity in 1921 vs 100 Years Later
It should go without saying that the UK has changed beyond recognition in the past 100 years or so.
In the early 1920s, Britain was still recovering from the First World War and the global Spanish flu pandemic.
George V sat on the throne, and it’d be another three decades until Queen Elizabeth II begun her time as Britain’s longest reigning monarch.
The BBC had only just start broadcasting (in 1922) and kids were playing with spinning tops, rather than smartphones.
How the UK generates its electricity has also been on its own journey, according to the latest figures from the Department for Business, Energy & Industrial Strategy (BEIS).
In the 1920s, electricity was rare, unreliable, and expensive, and less than one in ten UK households had access to any electricity at all.
In 1921, Britain generated 3,890 GWh of electricity and the overwhelming majority of that came from conventional thermal methods (i.e coal), with just 13 GWh coming from natural flow hydro methods. Honestly, there’s no point creating a pie chart for it.
The Rise & Fall of Coal
Fast forward to 2021 and the UK is working up 246,507 GWh of electricity. Coal made up 29,320 GWh but by far the biggest contributor was combined cycle gas turbine (CCGT) or natural gas with 108,417 GWh.
Electricity generated from coal peaked in 1979 when it made up 79% of the mix with 226,329 GWh. Following a gradual decrease, it dropped sharply between 2012 and 2019 to the point that it contributed just 11% in 2021.
Regardless of how your business’ energy is produced, you can compare the latest business energy prices and find the cheapest quote from our panel of trusted suppliers in a matter of seconds.
Simply enter your postcode to see how much you could save…
How the UK Generated Its Electricity Generation in 2022
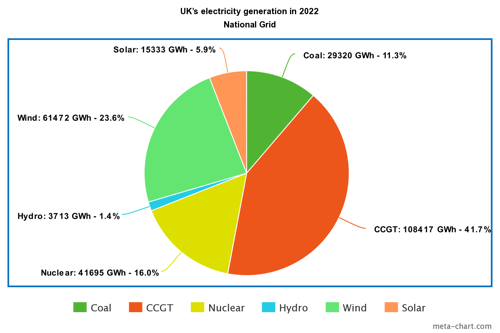
Source: National Grid
Banner photo: Dylan Hunter / Unsplash
Why pay more for the same energy?
Keep your business energy bills low
Find your latest energy deal in less than 30 seconds
Find the Latest Deals
Secure business energy quotes in under 30 seconds from a range of trusted UK energy suppliers.